If you want to check out statistics for other years and classes, take a look here.
There were 1346 entries to this class during the year. 65% of the entries were female.
 |
| 42% of class 11 entries came from category 2 |
 |
| 17.8% of all category 1 entries were entered to class 11 |
 |
| Percentage of entries per breed that were entered to class 11 |
 |
| Most popular colors |
 |
| Class 11 entries per base color |
 |
| Entries per amount of white |
 |
| Entries per tabby |
 |
| Results awarded. 9% of the entries were absent on the day of the show. |
 |
| 35% of entries were nominated and 10.9% gained BIS. This is 31% of nominated entries gaining BIS result |
 |
| Percentage of class 11 entries that were nominated |
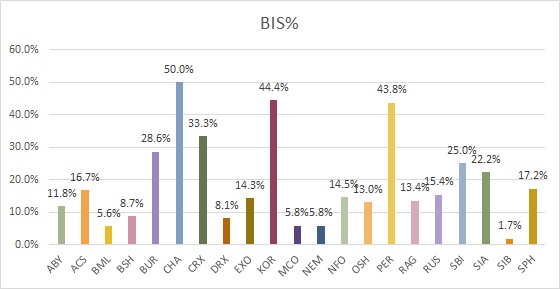 |
| Percentage of class 11 entries that gained BIS |
 |
| Percentage of nominated entries that gained BIS |
 |
| 15% of entries to class 11 gained BIV. Above is the BIV distribution per breed in class 11 |
 |
| BIVs per color in class 11 |
 |
| Judges that had class 11 entries assigned to them |
 |
| Class 11 entries per country of judge |
 |
| Entries per month of show |
 |
| Per city of show |
 |
| Per organizing club |
 |
| Per date (dd.mm) |
 |
| The amount of entries to class 11 was almost equal on Sunday and Saturday |
No comments:
Post a Comment